(Go back one page to co-stained compensation samples,
or back to the introduction).
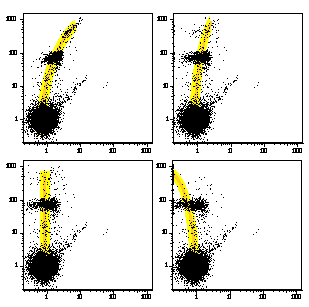
Below is a figure showing a sample of peripheral blood lymphocytes stained
with PE, and collected at several different compensation values (vs. FITC).
The top left panel is uncompensated; top right is under-compensated, the
bottom right is over-compensated, and the bottem left is properly compensated.
The bold yellow line has been added for emphasis only; no quantitative relationship
is implied by the curved shape of the line! In this example, the sample
has been gated for lymphocytes already, so that the autofluorescent monocytes
do not interfere with the analysis.
When compensating, you should make an attempt to visualize the equivalent
of this yellow line. Mentally line up the centers of the populations. The
ideal is that the positive and negative populations line on a straight line:
that is perfect compensation. The line should be straight for the entire
range of cells: from dimmest to brightest.
Note in the slightly-undercompensated panel, you might think that the compensation
is correct when you compare the main population of stained cells against
the unstained--it is quite close. However, the small population of very
bright cells is still clearly undercompensated. This is a classic example
of why you should use the brightest stain possible for compensation (for
a fuller discussion, see Requirements for Proper
Compensation).
In the slightly-over compensated panel, the same effect is seen. This example
is a little more insidious, because the overcompensate bright population
is against the left axis, and (in a dot plot mode), might be easily missed.
Again, the dimmer positive population still looks properly compensated.
Go on to an example of improper 3-color compensation.